Viewing and navigating tracks
Napari Track Edit visualizes tracks (and segmentations) through synchronized napari layers, a lineage tree view, and a table view. Selecting, centering, or filtering nodes in one view is reflected in all the others.
Track visualization
Tracking results are displayed with:
a Points layer, with nodes color-coded by tracklet ID and with symbols matching the state of the node:
△ dividing node
✕ end point node
◯ linear node
an optional Segmentation (Labels) layer, with label values matching node ids, but color-coded by tracklet ID
a Tracks layer, with tracks color-coded by tracklet ID
a Lineage View, available from
Plugins>Napari Track Edit>Widget - Lineage View, with nodes and edges color-coded by tracklet ID and with symbols matching the state of nodesa Table View, available from
Plugins>Napari Track Edit>Widget - Table, with all object properties.
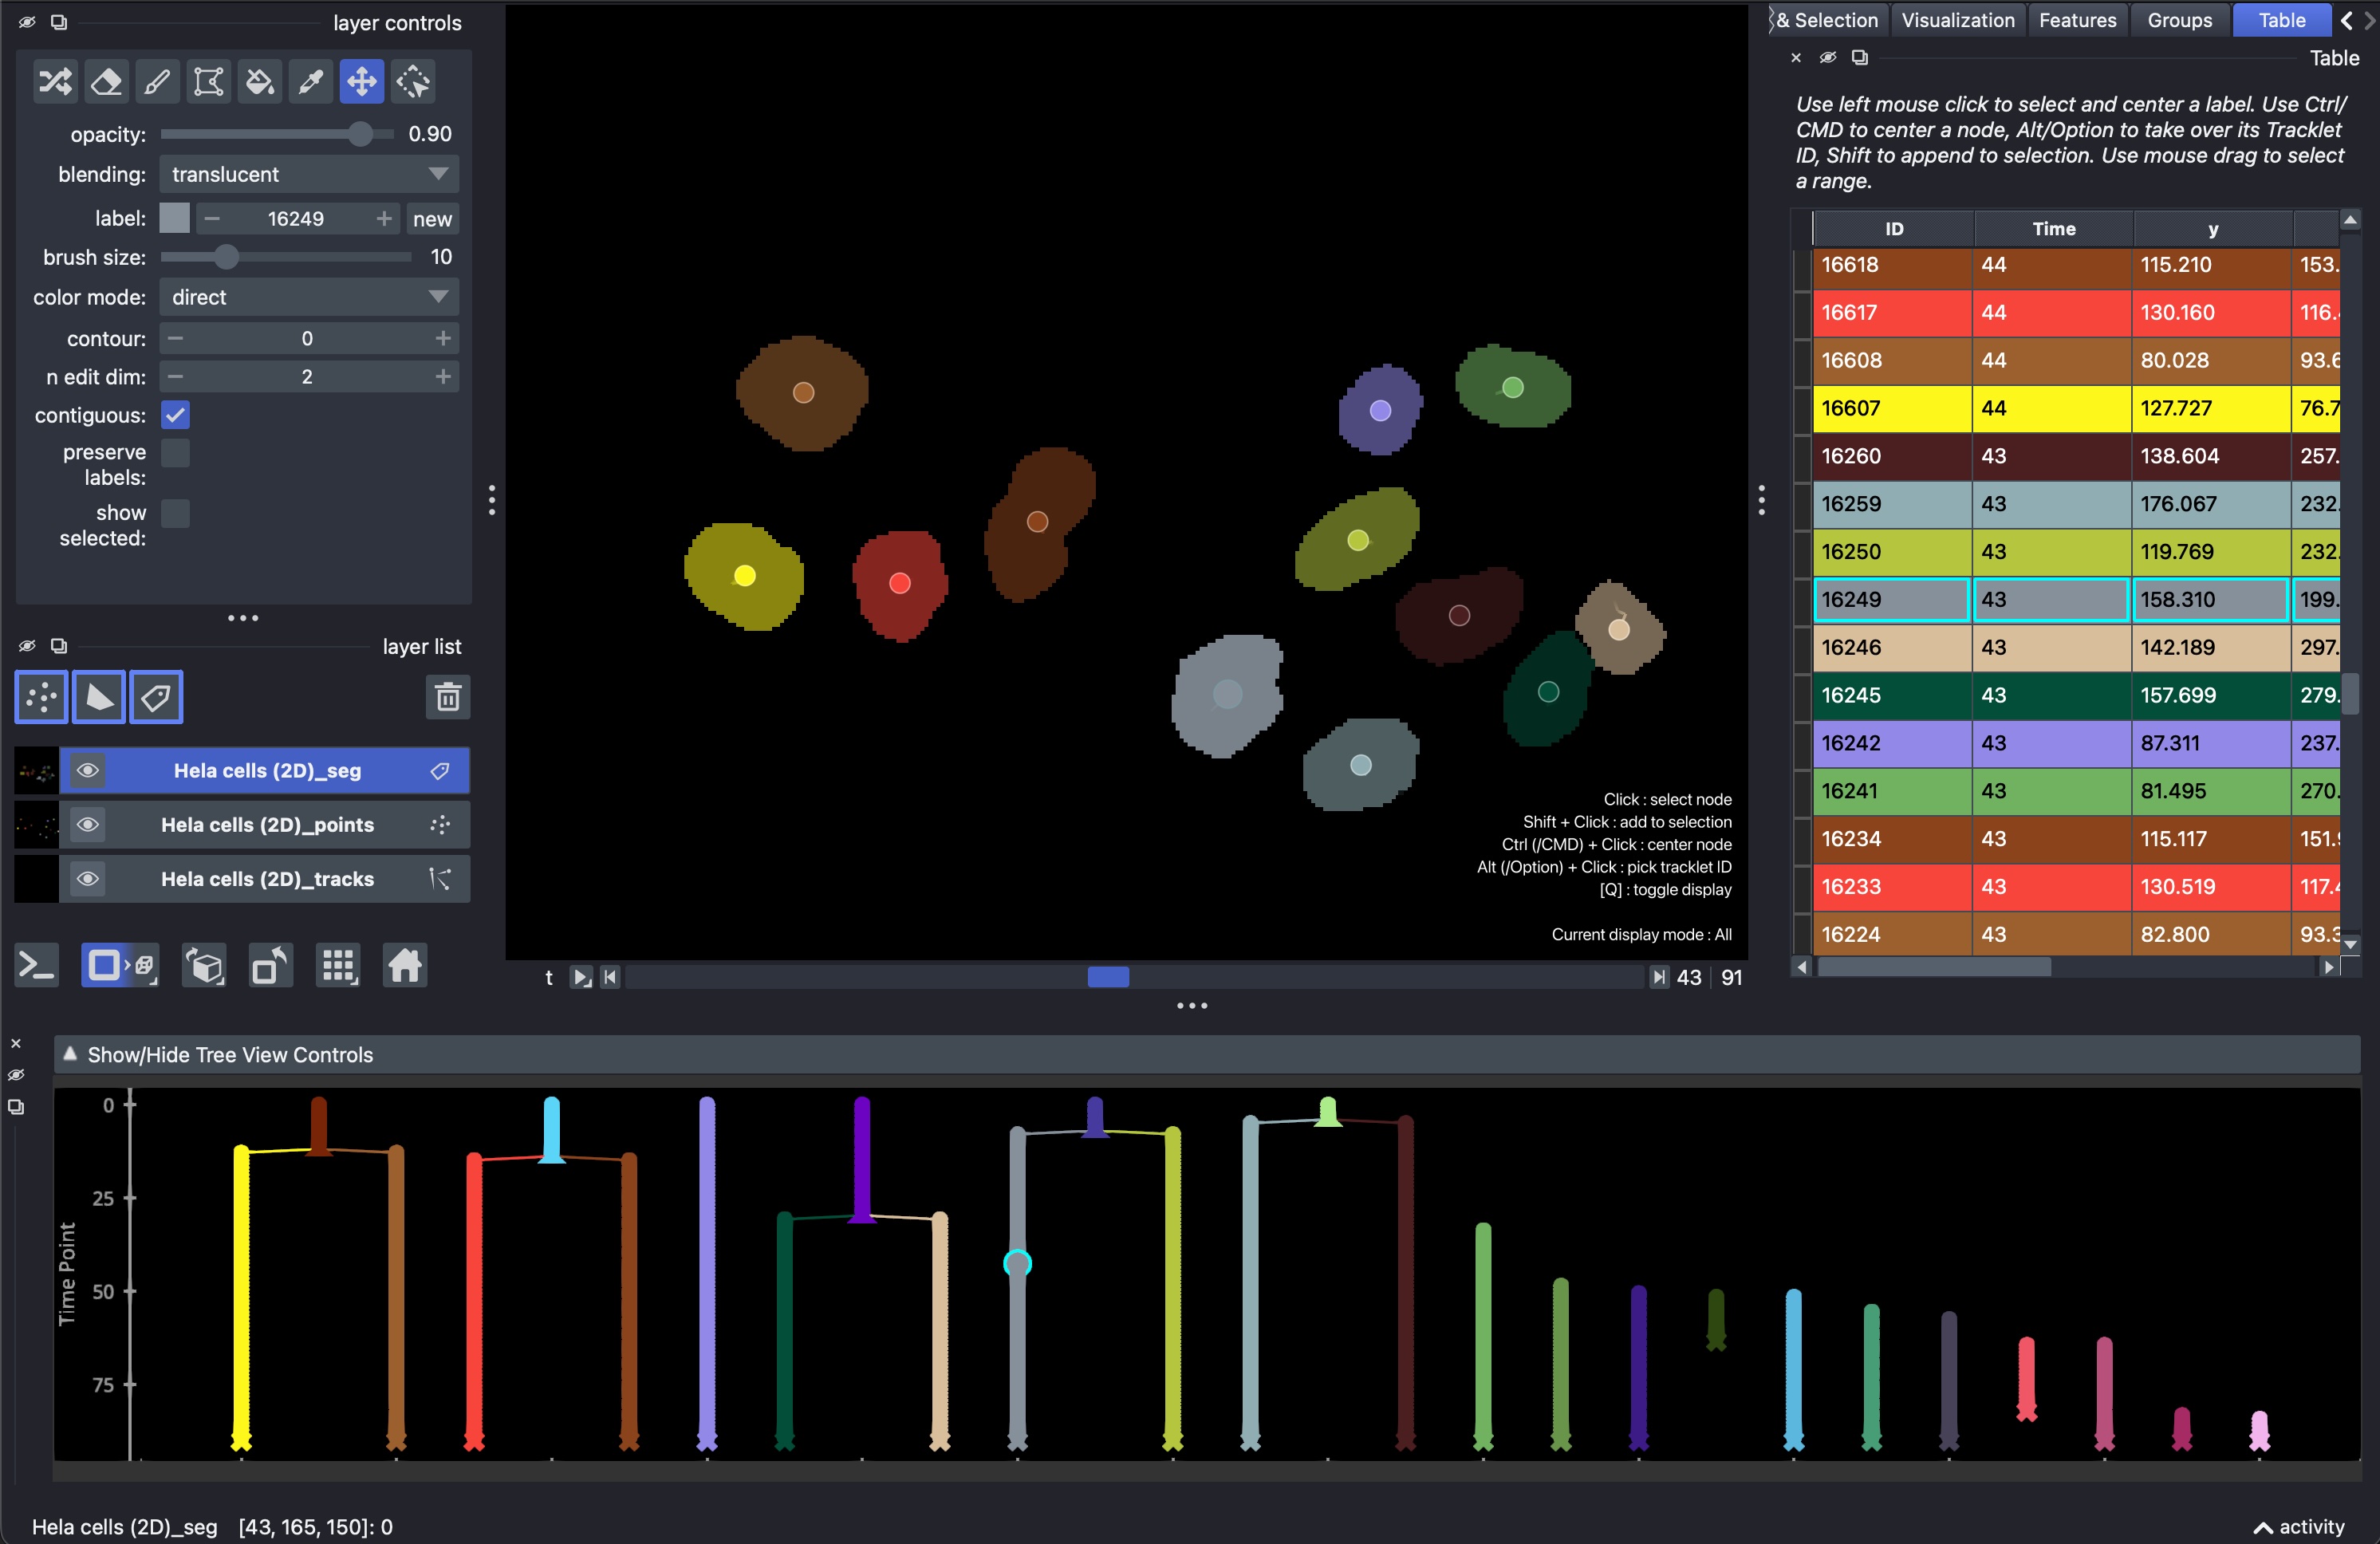
Viewing HeLa Cells (2D) sample tracks with the Table widget active
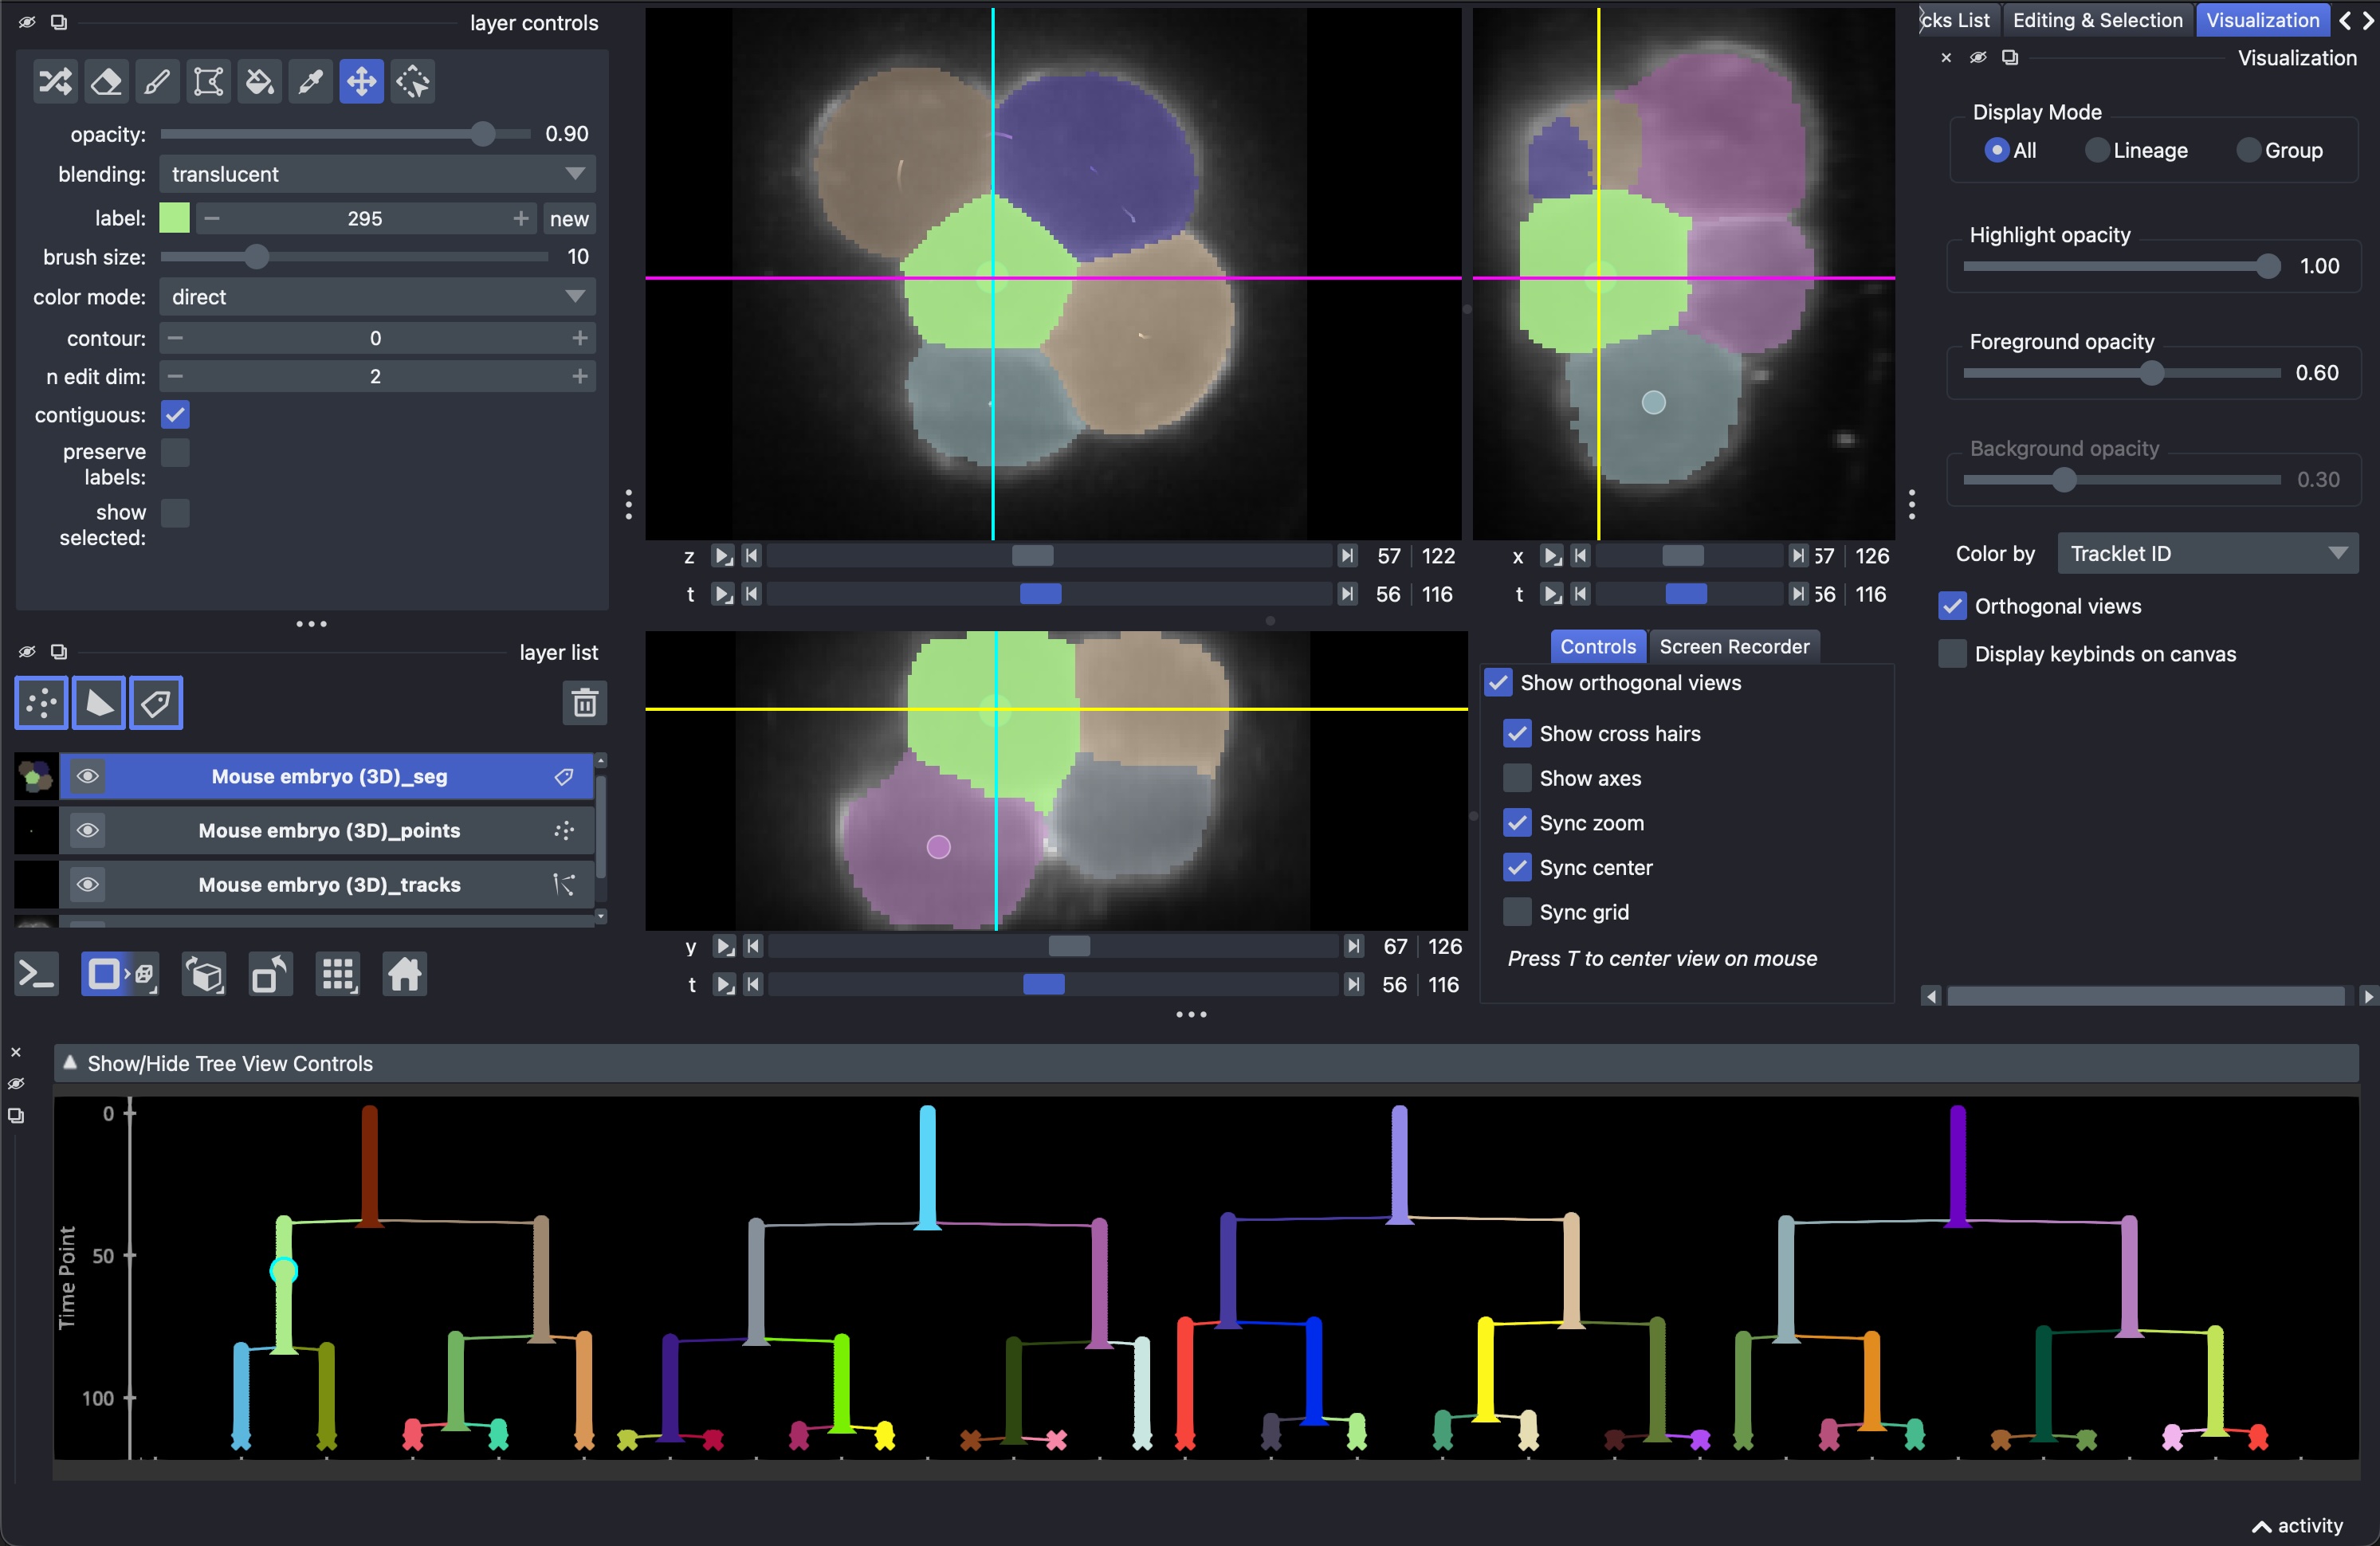
Viewing Mouse Embryo (3D) sample tracks with orthogonal views enabled
Tracklets and lineages
Every node belongs to a tracklet and a lineage. A tracklet is a linear stretch of a track between divisions: when a node divides, each child starts a new tracklet with its own tracklet ID. A lineage is the whole tree of connected tracklets that descend from the same ancestor. The tracklet ID determines the color of a node in all views, and it is also the “current track ID” used when adding new nodes.
Selecting nodes
You can select one or multiple nodes for closer inspection. Selection of nodes is possible in the Points and Labels layers, in the Lineage View, and in the Table view. Clicking on an individual node will select that node, highlighting it in all views. The view is centered on the selected node only when a single node is selected.
Use
SHIFT + clickto add/remove nodes to/from the selection without centering.Use
CTRL(/CMD) + clickto center the view on a node without changing the selection.Use
ALT(/OPTION) + clickto adopt a node’s tracklet id as the current one without selecting the node: this works like the pipette tool of the Labels layer, but it can be used on a node in any time point, so neither the current time point nor the camera moves.To select many nodes at once, use
SHIFT + mouse dragin the Lineage View, mouse drag with the ‘select points’ tool active in the Points layer, or mouse drag in the Table view.
Selection controls
The Selection section at the bottom of the Editing & Selection widget offers
the following controls:
Invert selection: select all nodes that are not in the current selection.The arrow buttons: when multiple nodes are selected, cycle through them, centering the view on each one in turn.
Deselect [ESC]: clear the selection.Restore selection [E]: restore the last selection.Previous Selection [P]andNext Selection [N]: jump back/forward through your selection history. The back/forward side buttons of your mouse do the same.
Lineage View
The Lineage View shows the tracks as lineage trees, with time on one axis and the
tracklets laid out next to each other on the other axis. It opens at the bottom of the
viewer with Open all widgets, or separately via Plugins > Napari Track Edit >
Widget - Lineage View.
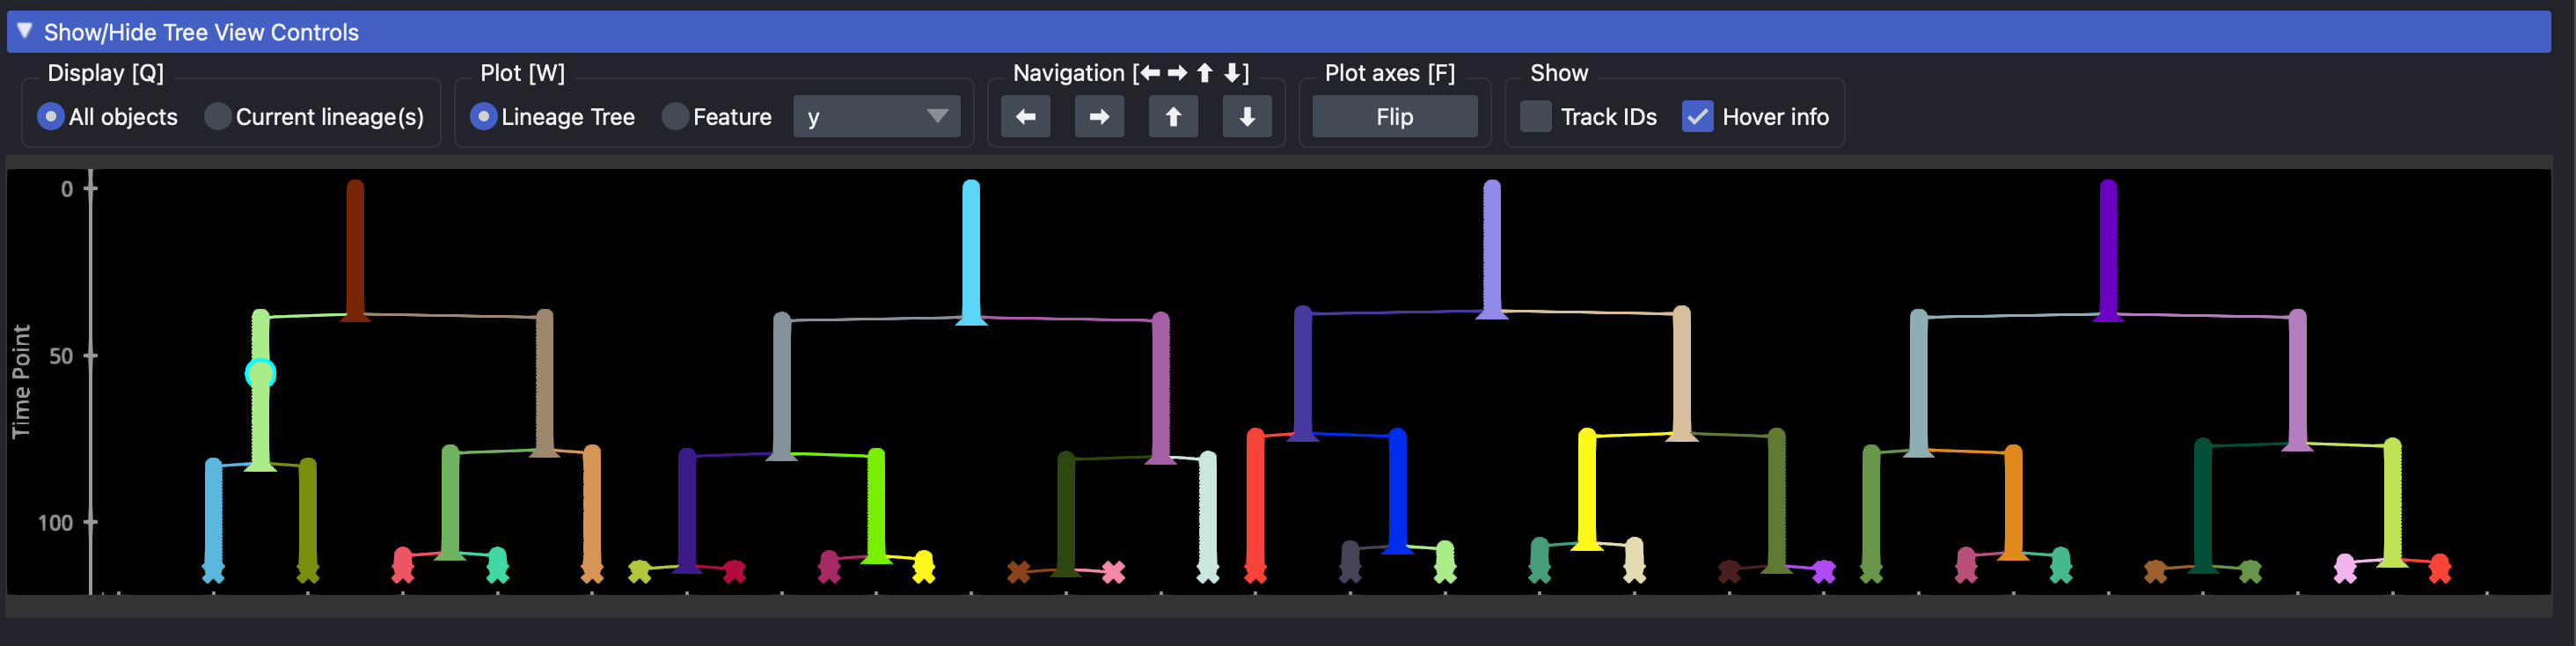
Lineage View widget with unfolded controls panel
Scroll to zoom in or out. Hold
XorYwhile scrolling to restrict zooming to one axis, or drag with the right mouse button to squeeze/stretch the axes.Mouse drag to pan, and right mouse click to reset the view.
Hover over a node to see its node, track and lineage ID.
The Show/Hide Tree View Controls bar at the top of the Lineage View opens the
following controls:
Display [Q]: switch betweenAll objectsandCurrent lineage(s)(see Viewing all nodes vs. selected lineages).Plot [W]: switch between plotting theLineage Treeand aFeature(see Measuring and displaying features).Navigation: select the node to the left/right, or move up/down through the tree. You can also use the arrow keys for this (make sure to click on the tree widget first). In the view of all lineages, up and down select the parent and child node; in the view of the selected lineages, they jump to the next or previous adjacent lineage.Plot axes [F]: flip the axes of the plot.Show: toggle labelling the track axis with theTrack IDs, and theHover infotooltip.
Table view
The Table widget lists all nodes with their time point, position, tracklet and
lineage IDs, and any features you have measured. Rows are colored by
tracklet ID. The table follows the same mouse conventions as the other views:
Left mouse click selects and centers a node.
CTRL/CMD + clickcenters the view on a node,ALT/OPTION + clicktakes over its tracklet ID, andSHIFT + clickappends it to the selection.Mouse drag selects a range of rows.
Click on a column header to sort the table by that column.
The editing and selection keyboard shortcuts also work when the table has focus.
Viewing all nodes vs. selected lineages
Especially in crowded datasets, it can help to restrict the display to only the lineages you are interested in. This can be done independently in the napari layers and in the Lineage View.
In the napari layers, the Display Mode in the Visualization widget has three
options:
All: display all nodes.Lineage: display only the lineages that contain at least one selected node.Group: display only the nodes in the currently selected group.
Pressing Q in the napari viewer cycles through these modes (All → Lineage → Group → All;
when no groups exist, it alternates only between All and Lineage).
In the Lineage View, the Display controls switch between All objects, which
shows all lineages (vertically), and Current lineage(s), which shows only the lineages
of the selected nodes (horizontally). Pressing Q with the Lineage View focused toggles
between the two.
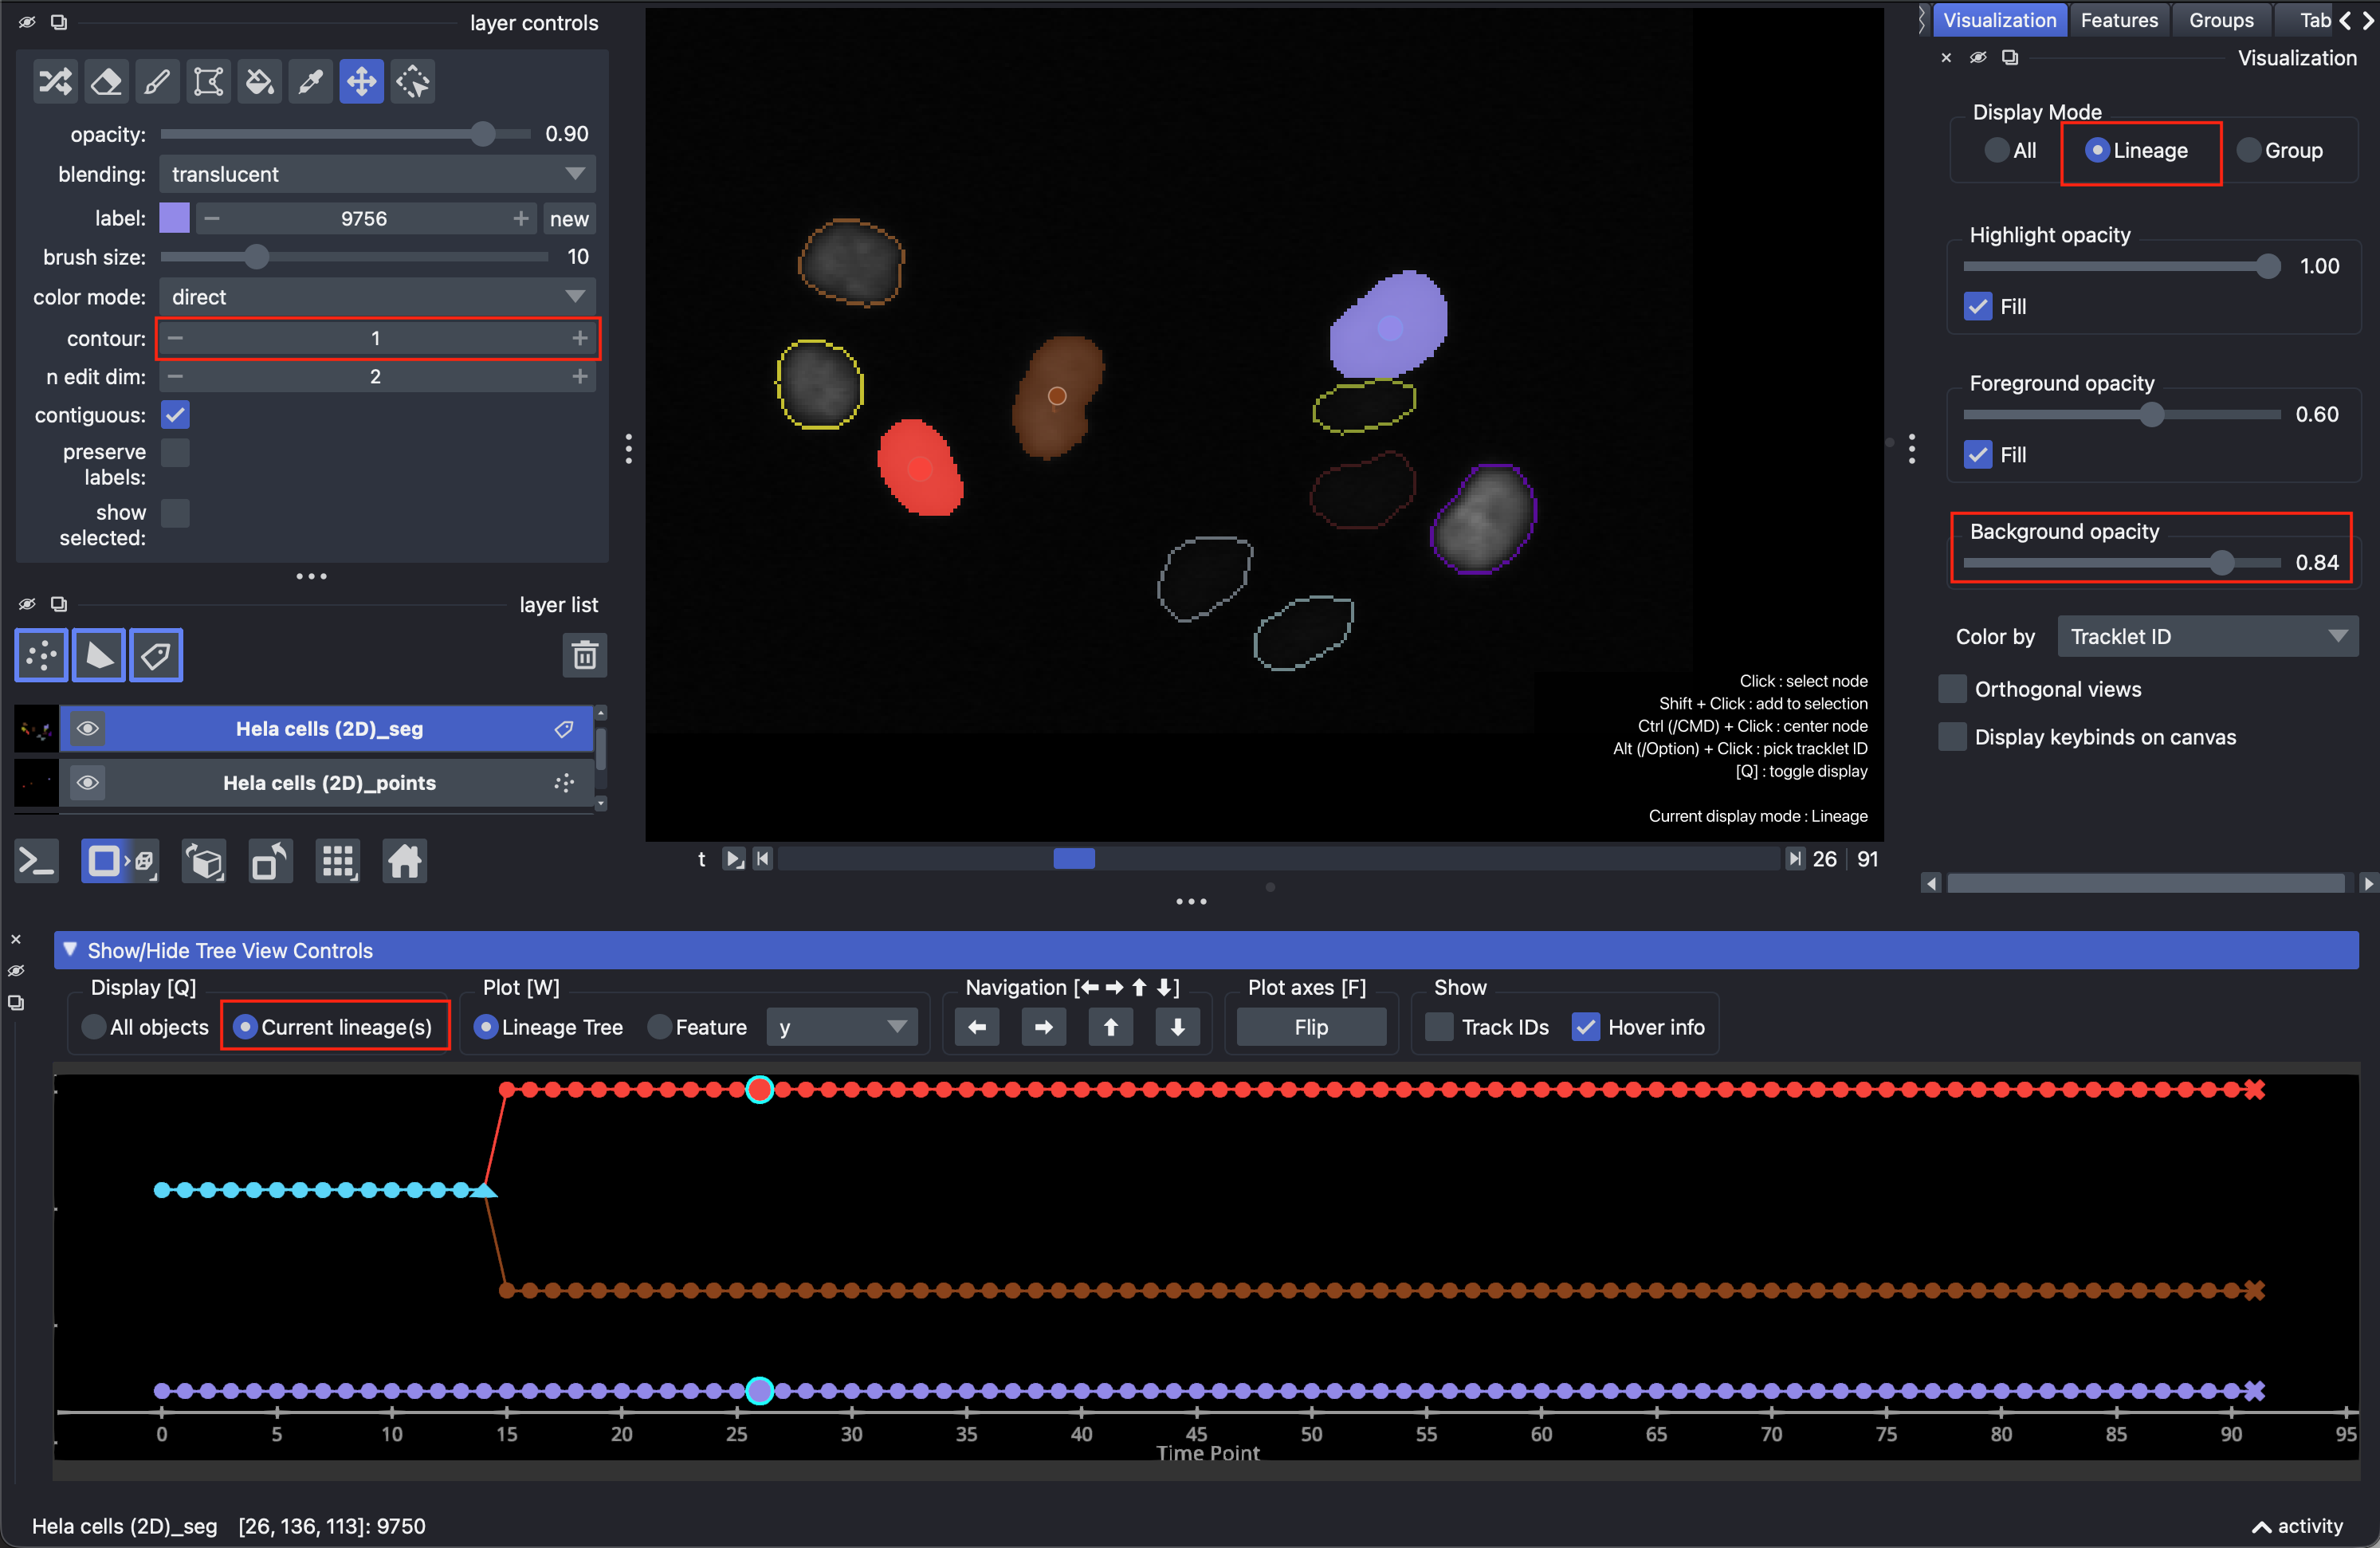
Display mode ‘Lineage’ in the Visualization widget, and ‘Current lineage(s)’ in
the Lineage View. Here, the contour value of the Labels layer is set to 1, so that
the Fill checkboxes and the Background opacity slider control whether labels are
drawn filled or as contours (see Visualization options).
Visualization options
The Visualization widget contains further display options for the napari layers.
If the tracks have a segmentation, the following options control how its labels are shown:
Highlight opacity: the opacity of the selected labels.Foreground opacity: the opacity of the displayed labels that are not selected.Background opacity: the opacity of the labels outside the displayed lineages or group. Only available in theLineageandGroupmodes; set it to 0 to hide them entirely.Fill: only shown in theLineageandGroupmodes when the Labels layercontourvalue (in the layer controls) is larger than 0. When checked, the highlighted or foreground labels are filled instead of showing their contours only.
The remaining options apply to all tracks:
Color by: the node feature used to color the labels, points, tracks, tree and table. You can color by tracklet ID (default), lineage ID, membership of a group, or chooseNoneto paint every node in one flat color.Orthogonal views: show orthogonal views of the data next to the main view. PressTto center all views on the mouse cursor. For 2D + time data, the ortho views show the time axis.Display keybinds on canvas: show or hide the text overlay with the most important key bindings and the current display mode.