Measuring and displaying features
Apart from the lineage tree, you can also view object properties, such as size,
shape, and intensity, in the Lineage View and in the Table widget.
Measuring features
If your tracks have a segmentation, you can select size, shape, and intensity
features to measure in the Features widget
(Plugins > Napari Track Edit > Widget - Features). Activating a checkbox computes
the feature for all nodes, and deactivating it removes the measurement again.
The available features are:
Area(2D) orVolume(3D), in calibrated units.Ellipse axis radii(2D) orEllipsoid axis radii(3D).Circularity(2D) orSphericity(3D).Perimeter(2D) orSurface Area(3D).Mean intensity: the mean intensity of each object in one or more image layers. When you activate it, a dialog asks which image layers to measure. Only image layers with the same shape as the segmentation can be selected; if you have multichannel data, please split the stack into the different channels first. Use the refresh button next to the checkbox to change which layers are measured.
Features are measured in calibrated units, so make sure that your layers have the correct scale before starting the tracking. Feature measurements are only supported if you are using a segmentation layer, since most features, like size, cannot be computed for points.
Measured features are kept up to date while you edit: painting or erasing part of a label updates the measurements of that node.
Displaying features in the Lineage View
All activated features appear in the Feature dropdown menu in the Plot [W]
section of the Lineage View controls. To display a feature, activate the Feature
radio button (or press W in the Lineage View) and select a feature from the list.
The Lineage View then plots the feature value of each node over time, instead of the
lineage tree. Selecting, centering, and navigating nodes works the same as in the tree plot.
It is often useful to combine this with the Current lineage(s) display mode
(see Viewing all nodes vs. selected lineages), to make the plot less crowded.
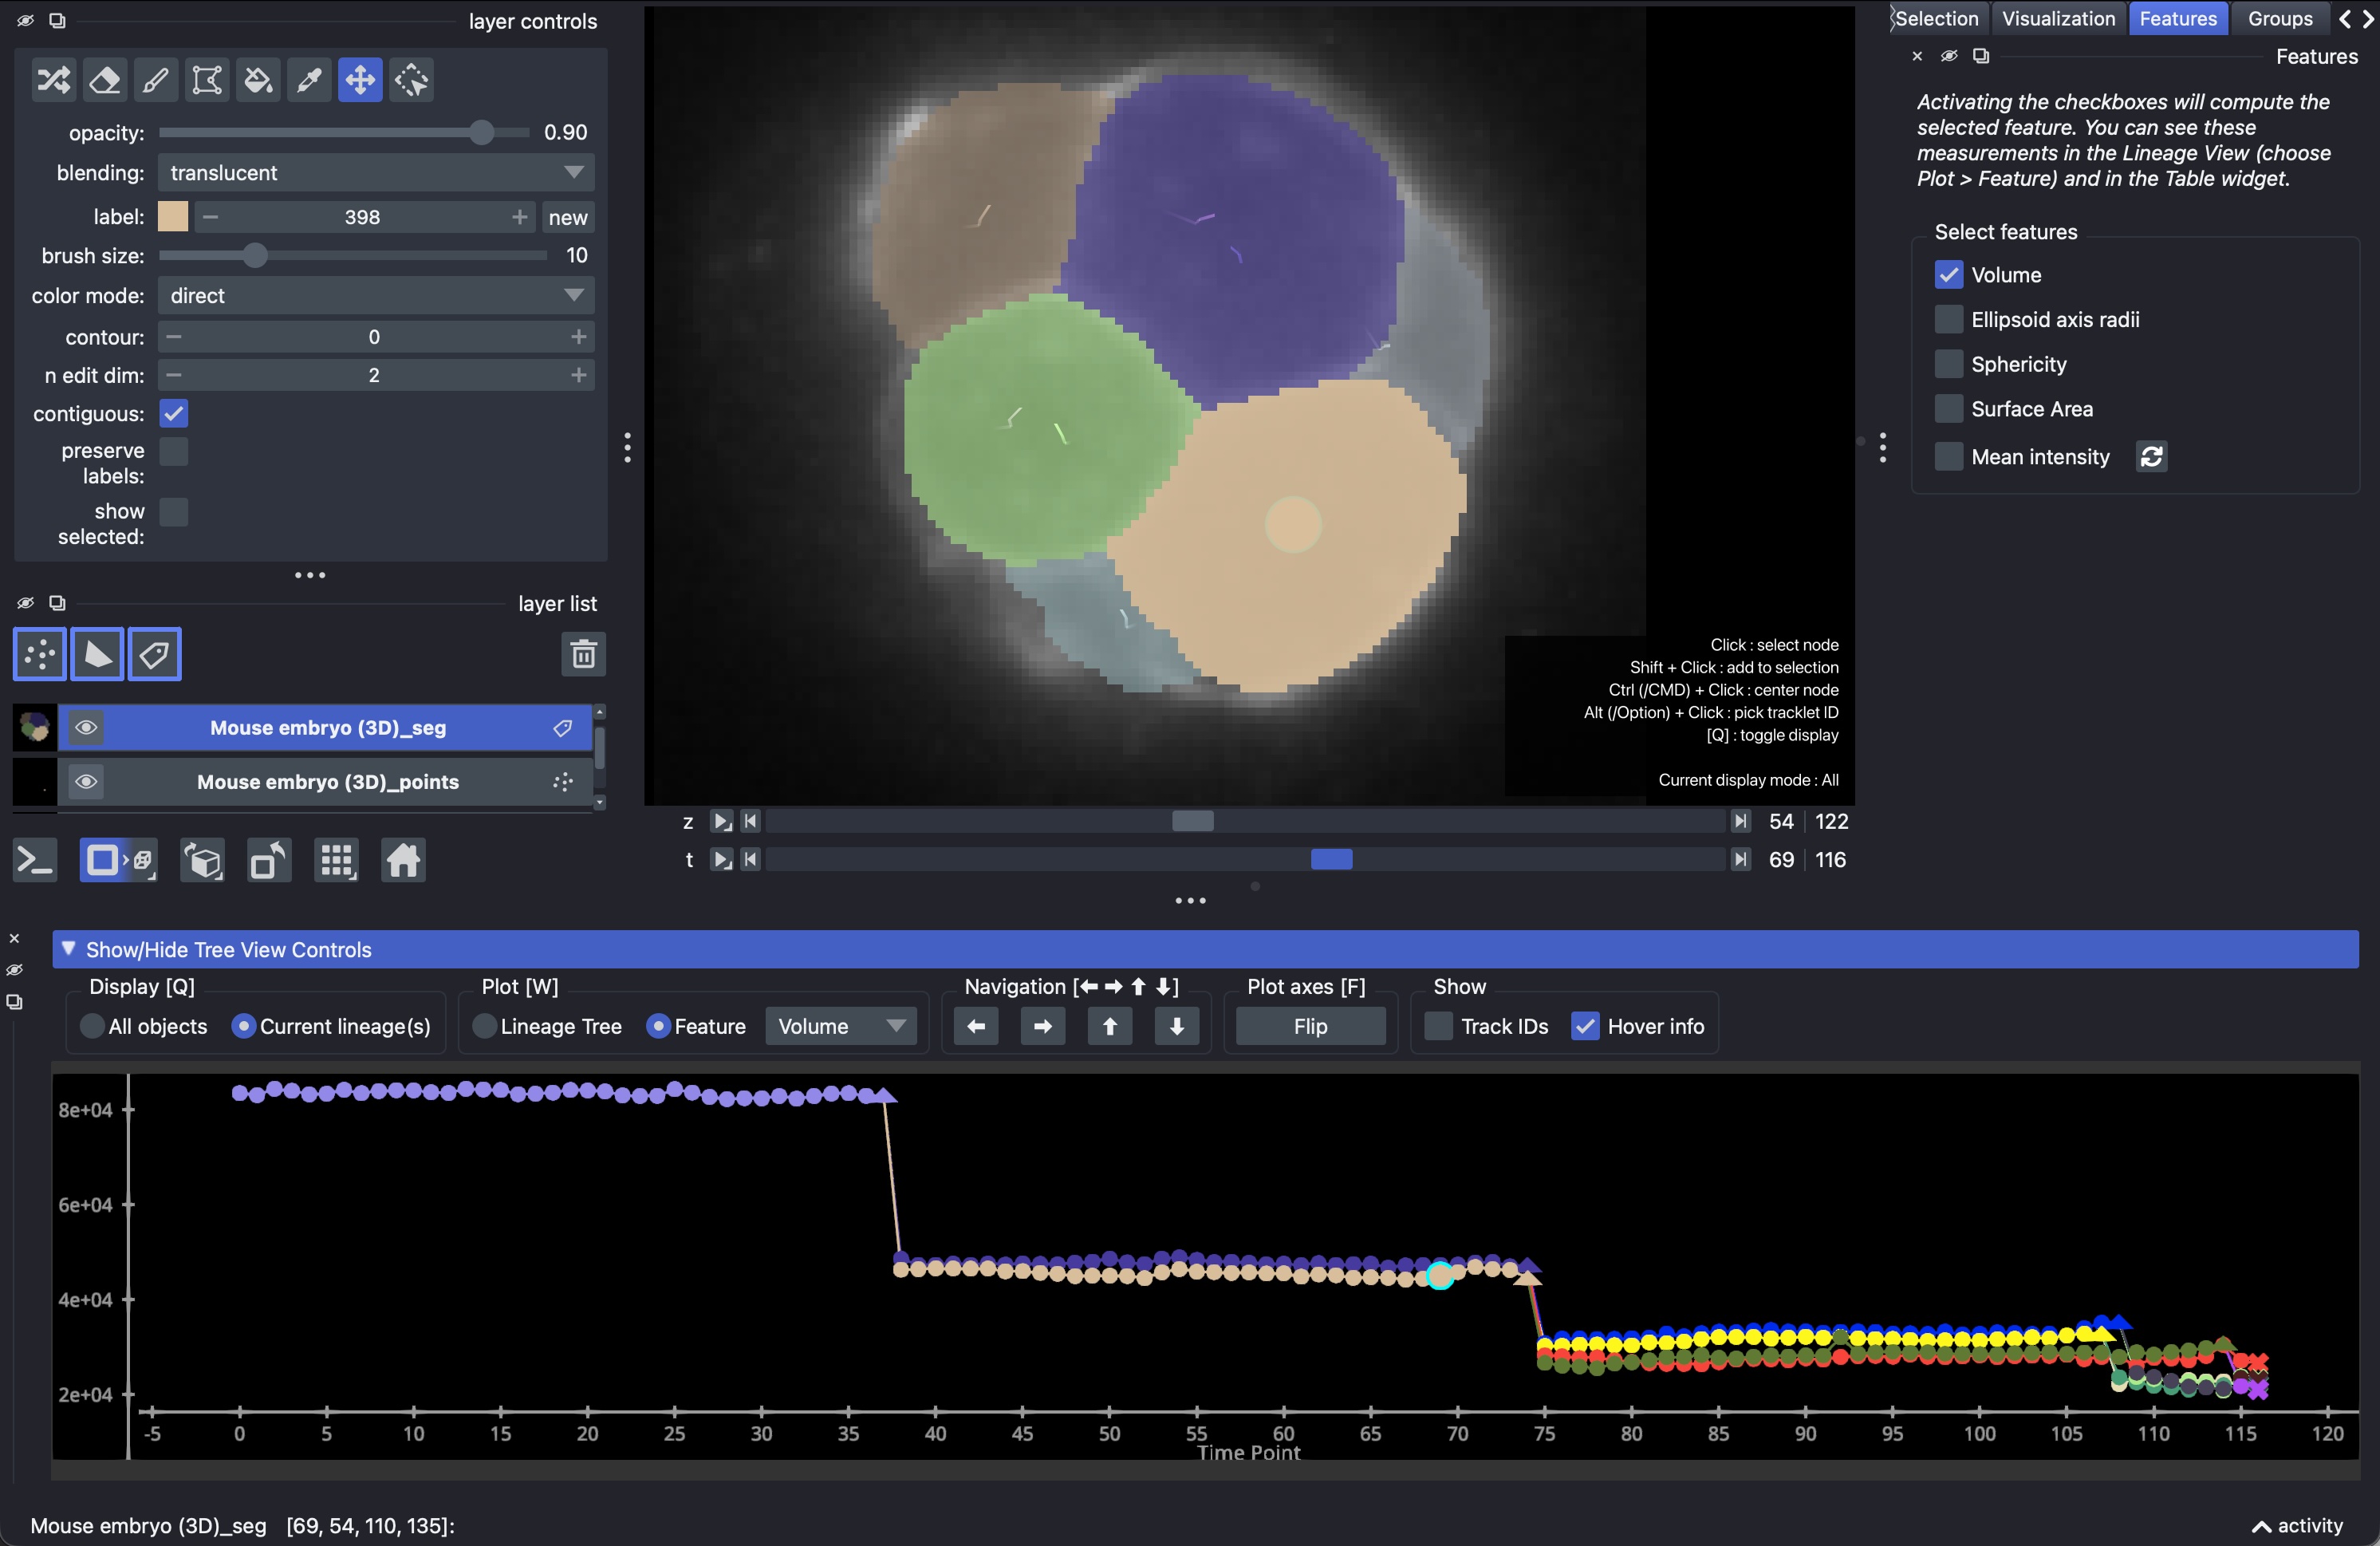
View object sizes of selected lineages.
Displaying features in the Table
All activated features also appear as columns in the Table widget
(see Table view). Click on a column header to sort the table by that feature, for
example to find the largest or smallest objects.